Sep 1, 2025
By Agnes L. DeFranco, Ed.D., CHAE, CHIA, CAHTA, CHE, Professor and Conrad N. Hilton Distinguished Chair, AHLEI Author
My Gosh! How Much Was My Food Cost Again? (An Analysis of the Cost of Goods Sold Variance)
Many managers simply accept the fact that when they sell more food than what is planned, the actual food cost will be higher than the budgeted food cost. Therefore, they never look behind the numbers. See, numbers don’t lie – so long as you know where to look, you will find the truth, and maybe treasures as well. Allow me to introduce to you your new best friend - Cost of Goods Sold (COGS) Variance!
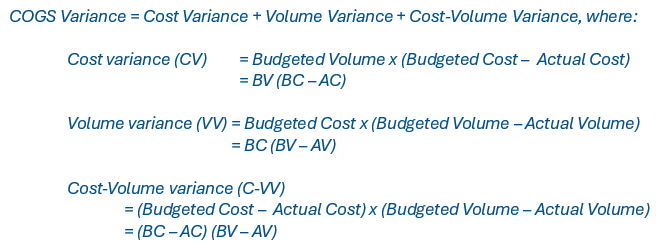
When you sell more covers in a restaurant, you use more food, and the food cost goes up. However, the cost of food, that one single number, contains a few parts. Sure, the cost depends on how much is sold (volume), but it also depends on whether the price of the item (cost) has increased or decreased. Therefore, the COGS Variance is a combination of three items as depicted in the set of formulas below:
Let’s use two examples with numbers to illustrate why a COGS variance can help management to understand their cost structures better and to make more effective decisions.
1. Sold More Food and Average Food Cost is Higher
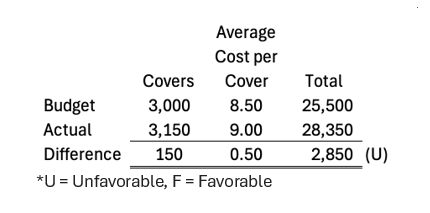
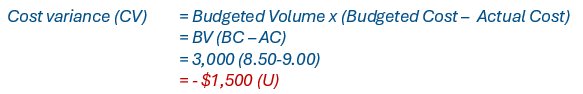
In this first scenario, a restaurant sells 150 more covers and the cost of each meal is also $0.50 more than budgeted. When dividing the COGS variance into its three segments, the first part of the of cost variance is -$1,500 because the average cost per cover has gone up from $8.50 to $9.00, and it contributes to this unfavorable variance by $1,500.
In addition, one look at the volume variance also shows that because the restaurant is selling 150 more covers, its cost goes up by $1,275. So, both the $0.50 increase in cost and by selling an extra 150 covers contribute to the $2,850 increase at a fairly similar rate.

Finally, the interaction between the increase in cost and the extra covers sold also contributes $75 to this negative effect, totaling to $2,850.
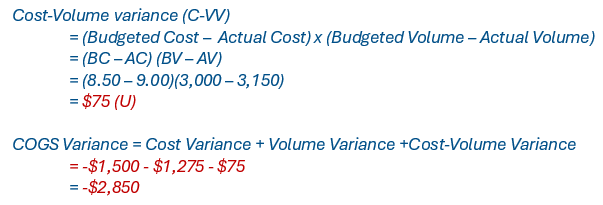
So, how should we interpret this? Overall because we sold more, and the cost also increased, the final COGS variance is not favorable. In this particular case, both the cost and the covers sold contribute quite evenly to this variance.
One caution in the mathematics of this analysis. In here, the cost-volume interaction shows an answer of positive $75; however, this is to be interpreted as unfavorable. If both cost and volume variances are negative or are positive, the cost-volume interaction is unfavorable. However, if they are not the same (one is positive, and one is negative), then the cost-volume interaction is favorable.
2. Sold More Food but Average Food Cost is Lower (A)
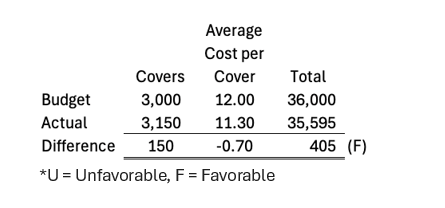
In this second scenario, the restaurant has a great day and sold 150 more covers. But their COGS variance is a favorable one at $405! So how can it sell more food but has a lower food cost? Well, this restaurant is able to find a product that is of the same quality and is able to cut the average cost per cover from $12.00 to $11.30! Of course, when selling more food, your food cost will increase, but if you can “manage” your cost, you might be able to net a positive variance; and in this case, $405 favorable! Let’s see how this works.
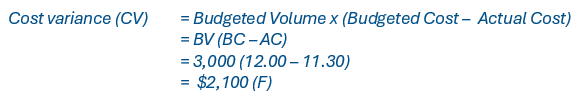
First, the good news – the cost variance saving of $0.70 per cover brought in a positive cost variance of $2,100!
And even with the restaurant selling another 150 covers, with a negative -$1,800 volume variance, the restaurant is still coming out better.

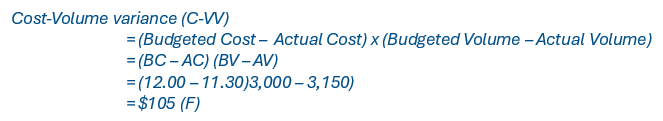
And, of course, when the cost and volume variance do not have the same sign (one is positive and one is negative), the interaction cost-volume interaction is favorable, adding to the previous two variances and totaling to a $405 favorable COGS variance!
The restaurant is in a good place. It sells more food to more customers and its management is able to find a way to manage cost to the extent that it actually saves money. Now, some of you may think this is impossible. Well, think twice! Just changing the pickles Chili’s restaurants use for their burgers saved Chili’s $500,000 (Evenden, 2025)!
Although the name of this variance is cost of goods sold variance, you have seen how it is applied to food. Similarly, it can also be applied to beverages or other merchandise your hotel, foodservice, clubs, or other hospitality establishments sell to your guests. An apple a day keeps the doctor away, and a variance analysis for your establishment can net you a better bottom line!
More detailed information and other examples of COGS variance can be found in Chapter 10 Operations Budgeting in Hospitality Industry Managerial Accounting.
By Agnes L. DeFranco, Ed.D., CHAE, CHIA, CAHTA, CHE, Professor and Conrad N. Hilton Distinguished Chair, AHLEI Co-Author of the Ninth Edition of Hospitality Industry Managerial Accounting.
Reference:
Evenden, J. (2025). Chili's CEO says the made a change to its most popular burger and no one noticed. the-sun.com. Retrieved from: https://www.the-sun.com/money/14121766/chilis-burger-change-pickle-ceo/.
Featured Articles
-
![A woman in a spa fixing towels]()
Feb 23, 2026
Addressing the Spa Industry Crisis: How Hospitality Education Can Bridge the Skills Gap and Solve the Labor Shortage
-
![A man handing over a card to check into hotel]()
Aug 1, 2025
Selling More Rooms = Making More Money: When Is This NOT True?
-
![Housekeeper cleaning a room]()
Jul 1, 2025
A Tale of Two Hotels and One Elephant in the Room: An Analysis of Variable Labor Variance


