May 14, 2025
By Michael L. Kasavana, Ph.D., CHTP, CFTP, MSU Professor Emeritus, AHLEI Author
The Power of Menu Engineering - Part Two
Part Two: ME Analysis
As mentioned in Part One, perhaps the oldest misconception is that food cost is directly related to profitability, which is not always the case. Consider a traditional steak and chicken example. If Chicken Bites has a food cost of $1.00 and a menu price of $3.00 it will have a 33% menu item cost. Similarly, if NY Strip Steak has a food cost of $2.50 and sells for $5.00, it will carry a 50% menu item cost. When asked which of these two items they would prefer to sell, some operators will be quick to identify Chicken Bites since it will yield a lower food cost percentage. The hidden factor in this analysis, however, is consideration of the difference between each item's selling price and food cost. This monetary difference is termed contribution margin. Contribution margin is a primary focus of menu engineering. Data elements can be identified.
Ingredient data – comprehensive menu item costs are important to an effective menu engineering analysis. Data sourcing can be a recipe costing application or manual analysis of plated courses. Data can be averaged across the four-week cycle to produce an accurate reflection of item expense.
Segmentation data – the separation of menu items into competing item categories (for example, appetizers, entrees, desserts) or meal period subcategories (breakfast, lunch, dinner, banquet, catered, etc.) increase the relative value of findings.
ME Modeling
Menu engineering begins with an interactive analysis of competing menu items. Items are categorized as high or low according to MM and CM achievement rules. A menu item with an MM greater than or equal to seventy percent of its equal menu share is considered high, otherwise it is labeled as low. Consider the following four-item menu:
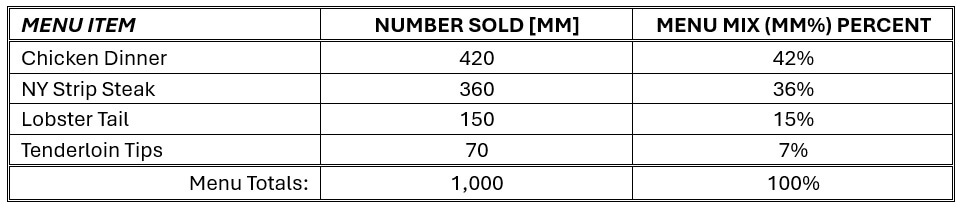
The menu engineering rule for categorization of menu mix is based on the formula: 1 / N (70%) where, N = number of menu items. In this case, the formula would produce a MM% achievement value of: 1 / 4 (70%) = .25(70%) = 17.5% Hence, evaluation of menu items against this rule produces the following categories within a menu engineering analysis:

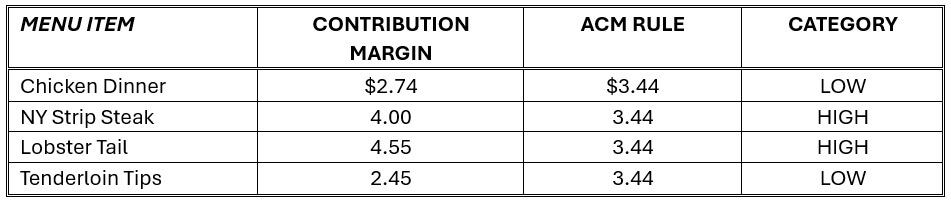
An item's individual CM is compared to the menu's average contribution margin (ACM) and grouped as high or low depending upon whether it is greater than or equal to the menu's ACM. In this example, the menu has a total contribution margin of $3,444.80 and an average of $3.44 ($3,444.80 / 1,000).
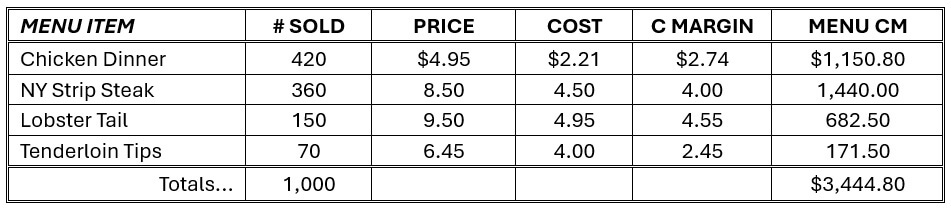
The menu engineering rule for categorization of contribution margin is based on the formula: Menu CM / Number of items sold. In this case, the formula would produce a CM achievement rule of: $ 3,444.80 / 1,000 = $ 3.44. Hence, evaluation of menu items against this rule produces the following categories within a menu engineering analysis:
Menu items designated as high in both MM and CM are classified as stars (winners). Items high in MM but low in CM are called plowhorses (marginal). Items low in MM but high in CM are termed puzzles (potential); while items low in both MM and CM are considered dogs (losers). Thus, in this example:
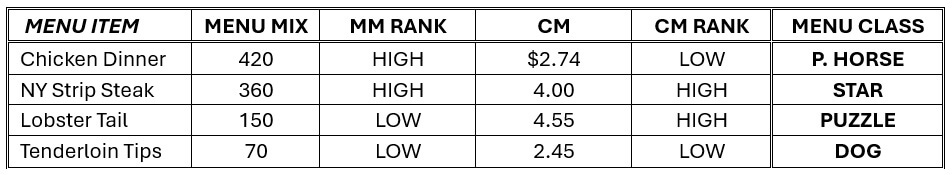
The menu engineering model goes a step further by identifying practical approaches to re-engineering the next menu. To illustrate, consider these simple strategies: star items should be retained, plowhorse items repriced, puzzle items repositioned (on the menu), and dog items removed.
Industry Examples
Restaurant 365
Five must have reports from restaurant365.com include flash reports, purchase reports, labor cost reports, variances report, and menu item analysis report. Flash reports include timely snapshot data of sales, labor, discounts, and related metrics. A purchase report helps identify potential pricing errors, comparative item costing across item categories, and percentage of item spending. Labor actual vs scheduled can be used to evaluate the success of forecasted labor and variances in labor expenditures. An actual vs theoretical variance report matches quantity, and dollar amounts and can be used to roll up to summary information by category for controllable costs of goods. Menu item analysis reveals the effectiveness of item promotions and profitability of menu items and enables balancing menu item popularity and profitability.
Toast
The Science of Menu Engineering. The Psychology of Menu Design. How to Make your Menu Work Smart, Not Hard. It’s a fact: Menu engineering is the latest restaurant industry buzzword. Most people know it involves analyzing restaurant sales data. Most people know it has to do with placing menu items where they’ll stand out. However, most people don’t know where to start. Or, more accurately, they don’t make time to start. But every second you don’t look at your menu prices, food costs, and contribution margins, you lose money on your best menu items. The Menu Engineering Bootcamp will give you a regimen to follow as you engineer your menu to increase restaurant sales. From day one, you’ll have actionable lessons, takeaways, and assignments to follow. By the end of the 30-day course, you’ll have an optimized menu, the menu engineering worksheets need to be tracked. Toast boasts an increase in restaurant sales of 27% following menu engineering analysis is not unreasonable.
Menu Cover Depot
A well-executed initial menu-engineering effort can increase a restaurant’s profits by 10% to 15%, or more, on an ongoing basis. The profit impact doesn’t stop there. Some restaurant groups squeeze additional profits out of the same menu that tend to be in the 10% range. The difference between the more and less successful attempts at menu engineering does not hinge on an establishment’s type or size. Instead, the determining factors are the restaurant owner/manager’s knowledge of the menu and willingness to put in the time and effort needed to understand the process and execute changes. In fact, some operations may significantly increase profits on a continuous basis.
Touch Bistro
Use the food cost formula to identify the cost of each menu item. Where Total Cost of Dish = Cost of Ingredient 1 + Cost of Ingredient 2 + Cost of Ingredient 3. This cost per serving is also known as the cost of goods sold. With the cost of goods sold, the next step is to calculate the gross profit margin using this formula: (Selling Price – Cost of Goods) / Selling Price = Gross Profit. Or simply the gross profit is selling price minus cost of goods sold. Data analysis will reveal item popularity providing an index into what guests are ordering and how frequently.
By Michael L. Kasavana, Ph.D., CHTP, CFTP, MSU Professor, Emeritus, AHLEI Author of the Eleventh Edition of Managing Front Office Operations.
Featured Articles
-
![A woman in a spa fixing towels]()
Feb 23, 2026
Addressing the Spa Industry Crisis: How Hospitality Education Can Bridge the Skills Gap and Solve the Labor Shortage
-
![A waiter holding a tray of food]()
Sep 1, 2025
My Gosh! How Much Was My Food Cost Again? (An Analysis of the Cost of Goods Sold Variance)
-
![A man handing over a card to check into hotel]()
Aug 1, 2025
Selling More Rooms = Making More Money: When Is This NOT True?
-
![Housekeeper cleaning a room]()
Jul 1, 2025
A Tale of Two Hotels and One Elephant in the Room: An Analysis of Variable Labor Variance


